


Waste: Circular Economy
SASB: CG-MR-410a.3, CG-HP-410a.1, CG-HP-410a.2, FB-FR-150a.1, FB-FR-430a.4, CG-EC-410a.2
GRI: 3-3, 301-2, 306-1, 306-2a, 306-3, 306-4, 417-1a
UN SDGs: 2, 11, 12
E | Published: June 2, 2023
Our Aspiration
We aim to break the link between consumption and waste as part of the larger global movement towards a more circular economy, meaning a transition from a “take-make-dispose” approach to one that values the reuse, recycling, and regeneration of materials. We aspire to achieve zero waste1 in our global operations and work with suppliers, customers and communities to accelerate the adoption of innovative packaging and products designed for circularity.
Key Goals & Metrics
Walmart’s waste metrics are based on calendar year (CY) unless otherwise noted.
| Operational Waste2, 3 | Metric | CY2020 | CY2021 | CY2022 |
| Global operational waste diversion | Percentage of waste materials diverted from landfill and incineration | 80% | 78% | 78% |
| Goal: Zero waste to landfill and incineration in our operations in Canada, Mexico, and U.S. markets by 2025 4 | Percentage of waste materials diverted from landfill and incineration per country | U.S.: 82% | U.S.: 81% | U.S.: 78% |
| Canada: 88% | Canada: 89% | Canada: 89% | ||
| Mexico: 71% | Mexico: 72% | Mexico: 80% | ||
| Global operational waste destination mix | Approximate percentage of waste by destination type (by weight) |
Recycling/reuse: 70% Donation to people: 5% Animal feed: 4% Composting: 1% Anaerobic digestion: 1% Incineration (with and without energy recovery): 1% Landfill: 18% Biochemical processing: <1% |
Recycling/reuse: 69% Donation to people: 5% Animal feed: 3% Composting: 1% Anaerobic digestion:<1% Incineration (with and without energy recovery): <1% Landfill: 21% Biochemical processing: <1% |
Recycling/reuse: 68% Donation to people: 5% Animal feed: 3% Composting: 1% Anaerobic digestion:<1% Incineration (with and without energy recovery): <1% Landfill: 22% Biochemical processing: <1% |
| Food Waste2 | ||||
| Goal: Reduce operational food waste 50% by 2030 (against 2016 baseline) | % reduction of food waste and inedible parts | 26% reduction | 18% reduction | 12% reduction5 |
| Global operational food waste destination mix | Pounds of food waste by destination type | Animal feed: 585M lbs. Biochemical processing: 27M lbs. Composting: 142M lbs. Anaerobic digestion: 108M lbs. Landfill or incineration: 837M lbs. |
Animal feed: 520M lbs. Biochemical processing: 68M lbs. Composting: 150M lbs. Anaerobic digestion: 73M lbs. Landfill or incineration: 995M lbs. |
Animal feed: 524M lbs. Biochemical processing: 106M lbs. Composting: 163M lbs. Anaerobic digestion: 113M lbs. Landfill or incineration: 1.297B lbs. |
| Global operational food donated |
Food donations globally | >745 million lbs. | >783 million lbs. | >760 million lbs. |
| Packaging6, 7 | ||||
| Goal: 20% private-brand plastic packaging in North America made from post-consumer recycled content by 20258 | Estimated percentage private-brand plastic packaging in North America made of post-consumer recycled content | 11%9 | 7% | 7% |
| Goal: 17% global private-brand plastic packaging made from post-consumer recycled content by 202510 | Estimated percentage of global private-brand plastic packaging made of post-consumer recycled content | 11%11 | 7% | 7% |
| Goal: 100% of global private-brand packaging recyclable, reusable or industrially compostable by 2025 | Estimated percentage of global private-brand packaging that is recyclable, reusable or industrially compostable12 | 54%13 | 58% | 63% |
| Total weight of global plastic packaging | Estimated total weight of private-brand primary plastic packaging, including plastic bags14 | ~1,200,000 MT15 | ~1,100,000 MT | ~1,100,000 MT |
| Goal: Reduce virgin plastic in global private-brand packaging 15% by 2025 (vs. 2020 baseline) | Percentage reduction (increase) in private-brand packaging virgin plastic, vs. prior year (based on supplier reports) | (3%) | (6%) | |
| Consumer Engagement | ||||
| Consumer recycling | Consumer recycling: Pounds collected through customer recycling programs at Walmart in Africa, Central America, Chile, and Mexico16 | >18 million lbs. | >1.9 million lbs. | >1.8 million lbs. |
| Goal: 100% of Walmart U.S. food and consumable private-brand primary packaging labeled with the How2Recycle® label by 2022 | Percentage of Walmart U.S. food and consumables private brand supplier-reported sales with How2Recycle® label17 | 57% | 80% | 92% |
| Percentage of Sam's Club private brand supplier-reported sales with How2Recycle® label | 67% | 84% | 83% | |
| Supplier Engagement | FY2021 | FY2022 | FY2023 | |
| Project Gigaton™ | Number of suppliers reporting progress on either or both the waste and packaging pillars of Project Gigaton | >1,000 | >2,100 | >2,600 |
Relevance to Our Business & Society
The World Bank estimates that global municipal waste will increase substantially by 2050, with at least one third of it managed in an environmentally unsafe manner, creating economic and environmental costs for communities, governments, and businesses. Packaging, and plastic in particular, from retail and consumer goods contributes to such waste. While it helps protect products, enhances food safety, and significantly reduces food waste, packaging often acts simply as a means for product transport. Once the end user has removed the packaging, it often becomes waste.
Millions of tons of food, products, and packaging move through our facilities each year. Wasting any of it ultimately drives up costs for Walmart and the communities we serve. Our stakeholders want us to eliminate waste in our own operations while also engaging suppliers and customers to help reduce waste upstream (in product production) and downstream (in households, including packaging and food waste), and move toward a more circular economy.
Reducing waste isn't just good for the environment, it is also good for business. One study estimates that, by 2040, plastic waste management alone will cost businesses $10 trillion, while shifting to a more circular economy could unlock $4.5 trillion in global economic growth by 2030. Walmart's actions to reduce unnecessary waste, increase recycling and reuse efforts, and ultimately pivot towards a more circular economy are necessary to reduce pollution, ensure natural materials and ecosystems are better protected, save money, and sustain the environment for future generations.
Walmart's Approach
We work to eliminate waste in our operations while engaging suppliers, customers and others to reduce waste in the broader value chain by:
- Eliminating operational waste: achieving zero operational waste in the United States, Canada, and Mexico by 2025 by addressing secondary packaging, assets, food waste, auto waste, and other items
- Increasing the circularity of primary product packaging: encouraging suppliers to design for recyclability, investing in local infrastructure, reducing/eliminating unnecessary packaging, reuse/refill initiatives
- Optimizing secondary packaging: reducing the use of plastic bags and e-commerce waste through innovation and customer engagement
- Minimizing food waste in the value chain: encouraging suppliers and customers to reduce food waste and support local food recovery/hunger relief programs, and
- Increasing product circularity: providing customers additional ways to buy gently used, refurbished, and restored products, as well as reintegrating unsold general merchandise and customer returns.
Key Strategies & Progress
Eliminating Operational Waste | Increasing Circularity of Primary Product Packaging | Optimizing Secondary Packaging | Reducing Food Waste in Our Value Chain | Increasing Product Circularity
Eliminating Operational Waste
We aspire to achieve zero waste in our global operations by 2025 and are designing end-to-end circularity programs for our operational waste.
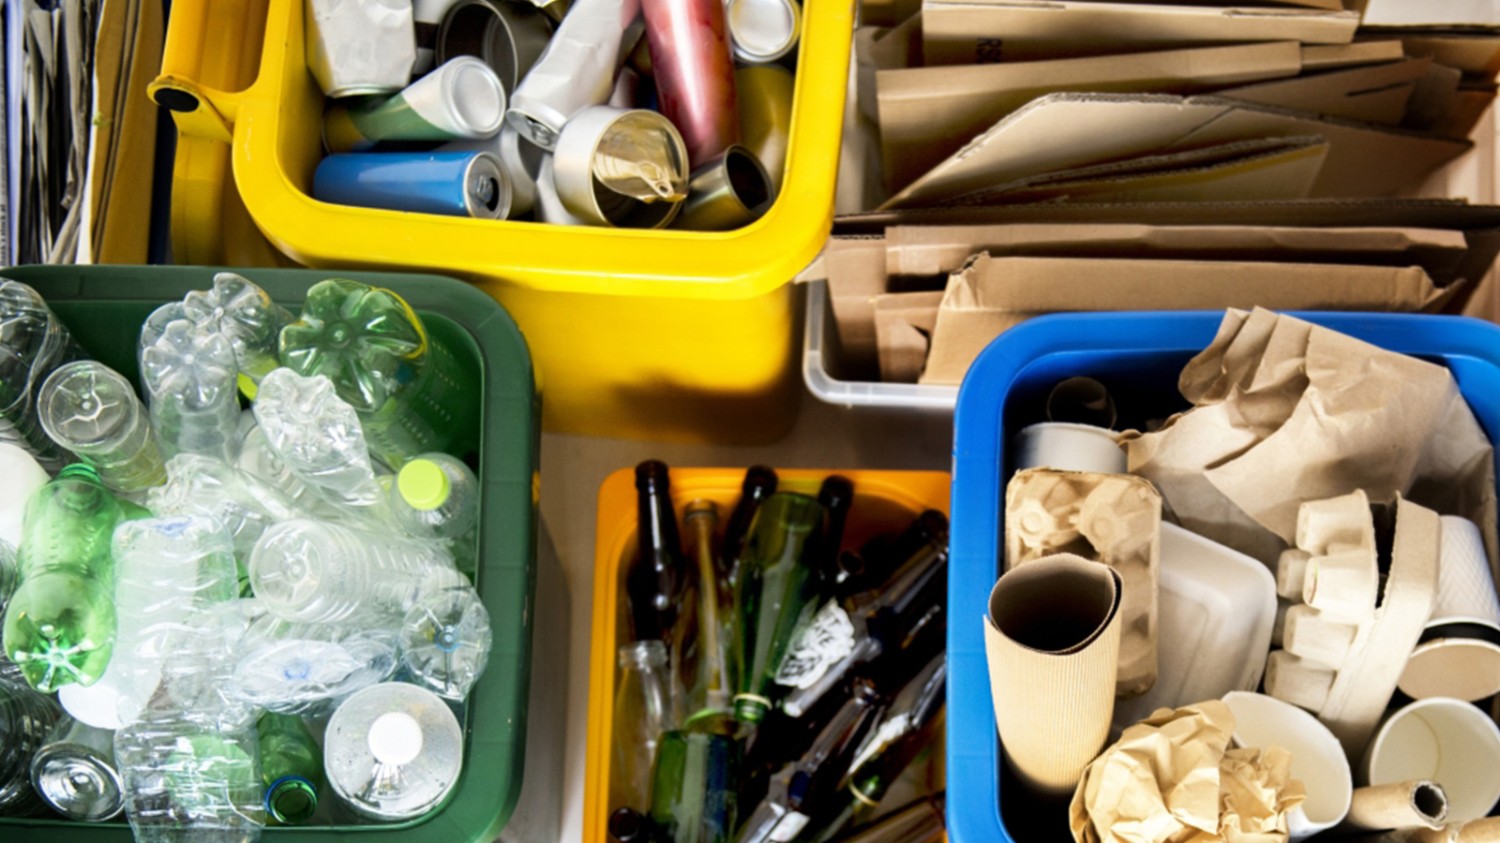
The primary sources of waste within our global operations (e.g., stores, clubs, distribution and fulfillment centers, truck fleet, and data centers) include secondary packaging like cardboard and plastics, unsold food, unsold general merchandise, automotive waste, and assets like signage, shelves, and carts. Of our total global operational waste, 94% is generated by three markets: the United States (78% of global total), Mexico (8% of global total), and Canada (8% of global total). Within these key markets, the primary sources of our operational waste include secondary packaging, receptacle waste, food loss and waste, automotive, and assets (including construction and demolition waste):
Primary Sources of Operational Waste
60%
18%
9%
5%
5%
3%
Secondary Packaging: 60%
Receptacle Waste: 18%
Food Loss & Waste: 9%
Other: 5%
Automotive: 5%
Assets: 3%
Globally, in 2022, we diverted 78% of our operational waste from landfills and incineration. Our diversion rate has remained essentially flat over the last three years primarily due to:
- Increased construction and demolition waste: We substantially increased the number of U.S. facilities under renovation in 2022, as compared to 2021, significantly increasing our remodel waste streams. While we reuse/refurbish many assets (e.g., fixtures, shelves, lights), some materials (e.g., used concrete and drywall) require more innovation to repurpose.
- Decreased use of cardboard: Historically cardboard has represented nearly half of the material in our operational waste streams and was diverted from waste streams at very high rates. However, our cardboard use has decreased as we have transitioned to more reusable operational packaging (e.g., breakpack boxes, reusable plastic containers) and worked to eliminate cardboard in our upstream supplier/product supply chains. While this reduction is overall positive, the reduction of cardboard available to divert in our operational waste streams has the practical effect of lowering our operational diversion rate.
- Operational execution: The pandemic led to a heavy focus on sanitization (requiring more single use materials), shifting associate priorities/responsibilities, and fewer internal waste assessments and in-person training opportunities. Operational waste increased slightly while our ability to effectively assess, train, and manage issues decreased.
Secondary Packaging
Throughout our operations, we aim to eliminate waste by reducing, reusing, and recycling the secondary packaging (e.g., cardboard, wood pallets, plastics) needed to run our business. Examples include:
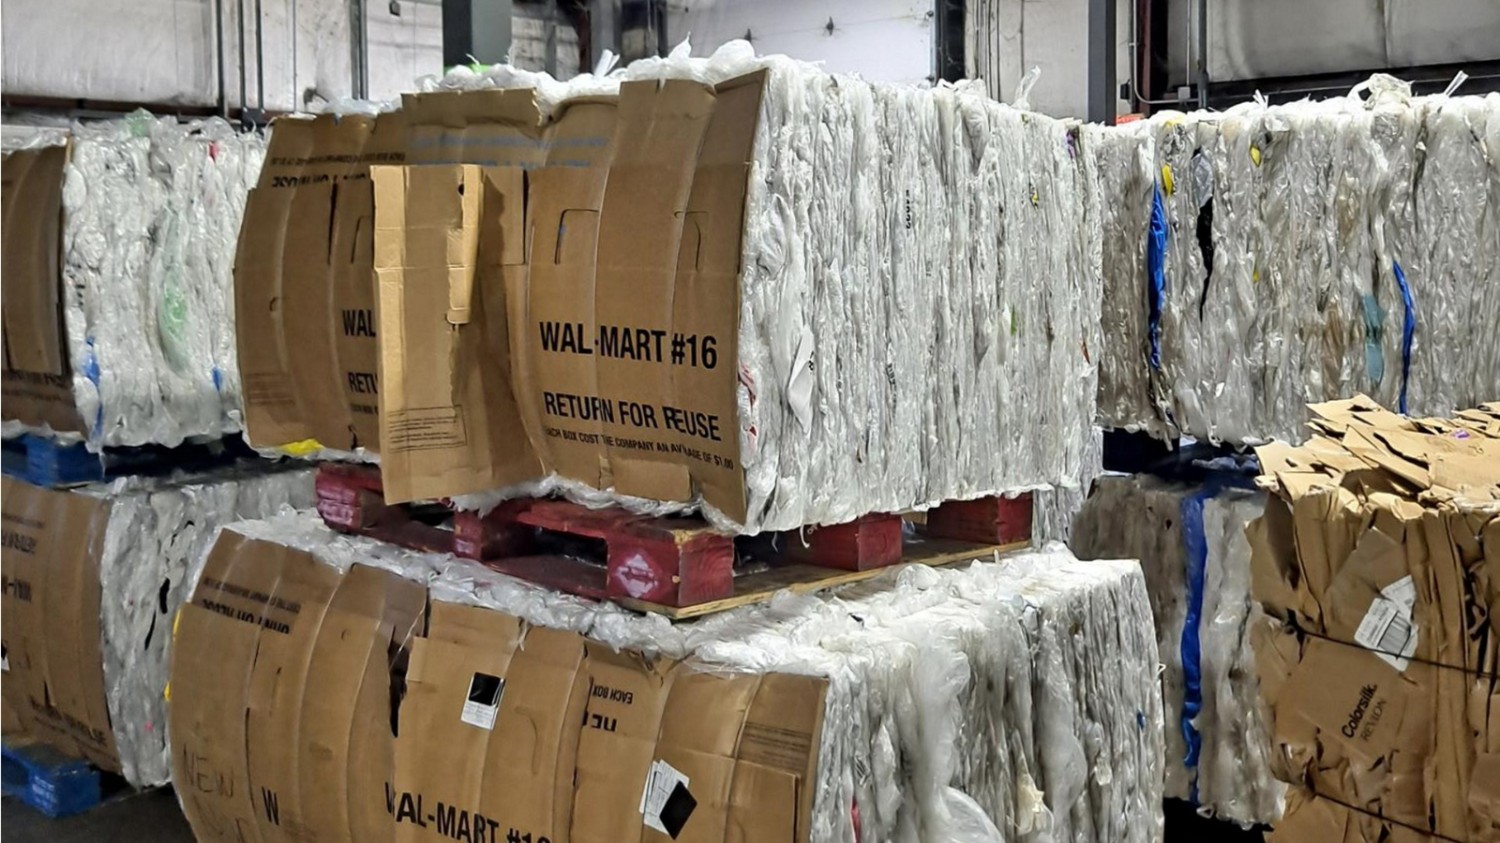
Corrugated cardboard, breakpack boxes, and reusable packaging: Our corrugated cardboard recycling program was launched nearly 20 years ago when we first announced our zero waste commitment. In 2022, Walmart U.S. recycled more than 5.8 billion pounds of cardboard. In addition to our cardboard program, we utilize reusable breakpack boxes, which reduces our overall cardboard usage; in 2022, for example, more than 44 million breakpack boxes were reused in our U.S. supply chain network. We also utilize reusable plastic containers (RPCs) for select produce, fruits, and eggs in key markets, with a goal to increase the usage of RPCs in fresh grocery from approximately 25% of units by the end of FY2023 to approximately 40% of units by the end of FY2025. In 2022 we utilized ~101 million RPCs.
Recycling rigid plastics and films: We contract with vendors to collect and recycle rigid plastics and plastic film produced from our operations and returned by customers. Some of these rigid plastics are converted into products that we sell in our stores and clubs (e.g., dog bowls, trash bags, seasonal items). In 2022, we recycled more than 313 million pounds of plastic film and rigid plastics globally, flat vs. 2021. In our supply chain facilities (e.g., distribution centers), Walmart generates plastic film-only bales by collecting secondary packaging like shrink wrap and other plastic-based pallet packaging.
Mixed recycle bales (MRBs) and film bales: To increase recycling of those materials we deal with day-to-day in our facilities, we instruct and train associates working in those retail facilities to gather and bale mixed recyclables (e.g., LDPE plastic, hangers, pill bottles, mixed plastics and paper, aluminum cans) as part of their responsibilities. In 2022, Walmart U.S. generated 109,000 tons of MRBs. We continue to train our teams and improve processes to minimize contamination and improve the overall recyclability of our MRBs.
Operational Food Loss & Waste
Each year, nearly 120 billion pounds of food is wasted in the United States, approximately 38% of the total U.S. food supply. This waste drives up greenhouse gas emissions, exacerbates water scarcity, and contributes to food insecurity. It also drives up food costs.
In addition to our zero operational waste goal, Walmart set a goal to reduce operational food waste by 50% (by 2030 vs. a 2016 baseline) in support of the Champions 12.3 10x20x30, CGF Food Waste Coalition of Action, and Pacific Coast Food Waste Commitment initiatives. As of the end of 2022, we had achieved approximately a 12% reduction.5 Our strategies for reducing food waste and achieving our goal include:
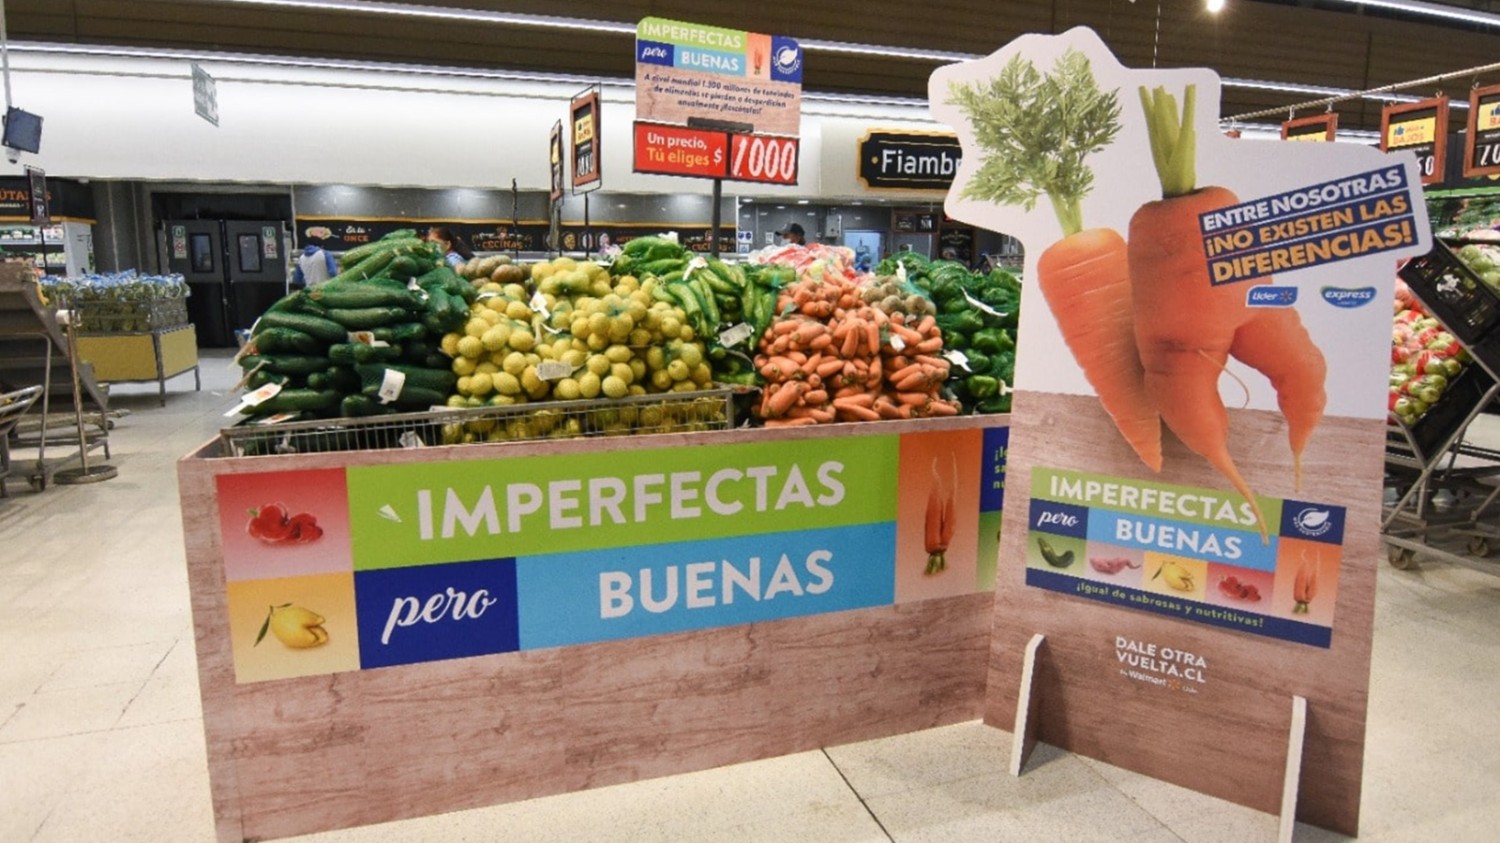
Reducing the volume of unsold food: To reduce our volume of unsold food, we have strengthened our forecasting and ordering tools to improve inventory flow, adjusted store fixtures to increase product turnover, enhanced distribution centers, and offered discounts on food that is imperfect or nearing its expiration date. For example:
- In the U.S., our stores and clubs sold more than 78 million food units through food discount programs in FY2023.18
- In Chile and Mexico, our "Imperfect but Good" programs offer customers the opportunity to purchase at discounted prices food that is either close to expiration or that has aesthetic defects.
Repurposing food near expiration: To reduce spoilage and waste, we repurpose select unsold food that is not past expiry. For example, where French bread is nearing expiry, we may turn it into dried croutons.
Donating unsold food: When food goes unsold, Walmart works to get it to people and places that need it while it remains nutritious. In FY2023, we donated more than 665 million pounds of food in the U.S. alone.19 Internationally, 365 stores in Chile are linked to the national food bank program, our China food donation program expanded from 10 stores to more than 100, and our Mexico stores donated more than 18,000 tons of food to partner institutions. In addition to supporting food banks and other charities, Walmart and the Walmart Foundation have funded increases in the capacity of the charitable meal system to recover and distribute fresh food, contributing over $14 million in FY2023 alone to support Feeding America, a nationwide network of 200 food banks in the U.S.
Converting non-edible food into other useful sources: Where food is no longer edible, we work with partners to convert it into other useful outputs (e.g., animal feed, compost, energy). For example, our stores in Canada, Central America, and the U.S. send a portion of their food waste to anaerobic digestion plants, which use bacteria to break down and transform food waste and biosolids into biogas that can be used as fuel and fertilizer.
Restoration and Reuse of Assets
With more than 10,500 stores, we own and manage a vast number of operational fixtures, products, and materials throughout our facilities. We aim to reuse or repurpose the assets not intended for purchase by customers (e.g., shopping carts, registers, displays and shelving) as well as unsold general merchandise. For example, in the United States in 2022 we reused and/or restored ~92% of our U.S. wooden pallets (>36 million pallets). When pallets reach their end of life, we aim to recycle them into functional products (e.g., animal bedding, mulch). In 2022, we recycled approximately 2.5 million pallets. We also sent an estimated 375K shopping carts to be repaired and/or restored. When our carts are unable to be repaired and/or restored, we work with third parties to liquidate these carts (85K in 2022) to avoid them going to landfill.
Remodeling, upgrading, construction, and demolition of our facilities also generates significant waste streams. When remodeling our stores and clubs we seek to reuse and/or refurbish operational fixtures. In 2022 for example, we refurbished nearly 741,000 shelves, racking systems, and other store fixtures in the U.S., saving 12.4 million pounds of steel. Despite this, store remodeling waste remains a key challenge, with the majority of construction and demolition debris making its way to landfills due to lack of local recycling infrastructure capable of managing this type of waste. The acceleration of our store remodels from ~600 stores in 2021 to ~700 in 2022 was particularly challenging from an operational waste perspective.
Auto Waste
Walmart and Sam's Club run large automotive programs which generate significant waste (e.g., tires, motor oils, vehicle batteries). Much of this waste is recycled/diverted in accordance with strict regulations (e.g., motor oils and spent vehicle batteries). For example, we partner with vehicle battery companies to manage a customer take back and exchange program that ensures proper recycling of the batteries. Where regulations allow for other creative approaches, we aim to develop interventions and pilot programs to divert as much waste away from landfills as possible. For instance, we convert used tires to shredded mulch and heavy-duty Member's Mark rubber mats (the mats utilize ~400,000 tires per year), and in 2022, we partnered with EcoTech to recycle more than 500,000 lbs. of car seats.
Managing Waste in our Facility Receptacles
The vast majority of our non-diverted waste streams are composed of waste found in our facility receptacles, for example:
- Compactors: Walmart's standard waste receptacle found at most of our facilities is intended to capture various facility waste (e.g., restroom waste, tenant waste, parking lot waste, interior sales floor waste, contaminated packaging). However, through audits we have found that a portion of our compactor waste can be diverted from landfill.
- Open top dumpsters: These large bins are intended to capture specific bulky waste for a limited period of time (e.g., cleanup after storm damage), but also act as backup receptacles when our compactors are not operational. They are occasionally used for illegal dumping on our property.
- Customer trash: We include customer trash bins throughout our parking lots, stores, and clubs as a convenience to customers and to avoid littering. These bins have become catchalls for customer waste.
We aim to reduce the total amount of waste collected by these receptacles, as well as develop interventions to divert the waste found in these locations. To that end, our teams conduct multiple waste assessments each year and perform ad hoc in-person and virtual site visits. Waste assessments include visual observations and/or sorting trash contents to identify opportunities for improved diversion program execution; in 2022 Walmart teams manually sorted and assessed more than 271,000 lbs. of waste to identify improvement opportunities).
Increasing Circularity of Primary Product Packaging
Some product packaging is necessary—for example, to ensure the safe transport of products and to keep food fresh. But reducing packaging—especially plastic packaging—is critical to mitigating environmental damage for many reasons, including reducing waste and pollution, conserving natural resources, and reducing GHG emissions. The UN Environment Programme (UNEP) estimates that the world threw away around 300 million tons of plastic in 2019 (75% of the amount it produced), nearly equivalent to the weight of the human population.
We aim to eliminate all unnecessary product packaging; accelerate a transition to necessary packaging that is reusable, recyclable, or industrially compostable; increase the percentage of packaging that is made of post-consumer recycled content; and reduce our plastics footprint. In support of these outcomes, we have set the following goals:
- Achieve 100% recyclable, reusable, or industrially compostable private brand packaging by 2025; as of the end of 2022 we were at 63%.12
- Achieve more sustainable packaging inputs, including goals to:
- Reduce Walmart’s virgin plastic footprint by 15% (vs. a 2020 baseline), including single-use products, packaging and single-use plastic bags; as of the end of 2022, our footprint had increased by 6%.
We are also committed to transparency in reporting, and have committed to annually report progress on our plastic packaging goals through the Ellen MacArthur Foundation’s New Plastics Economy Global Declaration.
The following strategies, discussed in more detail below, support achievement of these objectives:
- Recycling: including designing for recyclability, accelerating supplier/industry progress on circularity, equipping customers with helpful recycling knowledge, and working with municipalities to expand capacity;
- Reducing: including category and item-level efforts to eliminate/reduce packaging, including changing the format of products themselves (e.g., solids vs liquids); and
- Reusing/Refilling: including piloting new returnable and refillable packaging initiatives.
Project Gigaton also encourages suppliers to support these objectives (e.g., optimize packaging design, source packaging materials sustainably, and reduce packaging), among other actions, and report on the results via the Packaging pillar. A breakdown of our packaging footprint by material may be found in the chart below. In FY2023, over 2,600 suppliers reported on either or both of the waste and packaging pillars of Project Gigaton. As of the end of 2022, more than 2,500 suppliers have set SMART (Specific, Measurable, Achievable, Relevant, and Time-limited) goals related to waste through the Project Gigaton platform. For more information on Project Gigaton, please see the relevant section in our Climate Change brief, or visit Project Gigaton online.
| Material Types | Weight (MT) | % of our plastic packaging footprint21 | Recycled and/or certified material (% PCR by material) |
| Plastic | 1,143,441 | 54% | 7% |
| Corrugate & Paper | 754,795 | 36% | 27% |
| Metal | 138,517 | 7% | 20% |
| Glass | 76,673 | 4% | 20% |
| Other | 4,951 | <1% | 2% |
While plastic packaging currently comprises about 54% of our overall packaging footprint, it creates outsized challenges. Increased plastic use, including single-use and non-recyclable plastics, often means more plastics ending up in our natural environment. To help drive industry ambition in this space, in 2020, we joined the U.S. and Canada Plastics Pacts as part of the Ellen MacArthur Foundation’s initiative to create a circular economy for plastics. The effort seeks to unify businesses, government entities, NGOs, researchers and other stakeholders around a common vision for a circular economy for plastics, which includes an aspiration to recycle or compost 50% of plastic packaging by 2025.
Achieving these goals requires us to use multiple levers, such as eliminating unnecessary and hard-to-recycle plastic packaging and substituting plastic packaging with alternative materials. Interventions for problematic packaging are noted in the table below.
| Plastic Types20 | Most common packaging formats | % of our plastic packaging footprint21 | % Designed to be Recycled | Intervention method |
| #1 (PET) #2 (HDPE) |
PET: Bottles, jugs, cups, jars, trays, clamshells, blister packaging | 53% | 94% | Optimize for improved recyclability through design; incorporate recycled content for maximum circularity |
| HDPE: Bottles, jugs, cups, jars, tubes, bags | ||||
| #3 (PVC) #6 (Polystyrene) |
Trays, clamshells, blister packaging, inner packaging | 5% | 0% | Eliminate; substitute with alternative materials |
| #4 (LDPE) | Bags, films, sachet | 28% | 92% | Redesign to mono-layer PE and collect in-store via store drop-off at all Walmart locations |
| #5 (Polypropylene) | Cups, bottles | 6% | 86% | Work to expand recycling through The Recycling Partnership’s Polypropylene Coalition |
| #7 (other plastic types) | Bottles, films | 9% | 0% | Minimize use when possible to reduce contamination |
Working Collectively for Change
No single action will bring about a circular economy. A 2020 Pew Charitable Trust and SYSTEMIQ analysis illustrates the systemic action required by business, civil society, and government to meaningfully decrease plastic pollution. The analysis includes a roadmap that outlines a combination of approaches that should help address the problem, including investments in new technology, increased recycling, reduction and reuse, adjustments to public policy, changes in consumer behavior, additional materials R&D, and improved recycling and waste management infrastructure. This roadmap builds on research from the Ellen MacArthur Foundation, which found that recycling alone was not enough to fix the problem. Rather, large scale reuse models and innovations are required to make plastics more reusable, recyclable, or compostable.
Recycling
Creation of a circular system for necessary product packaging requires reducing virgin content and increasing post-consumer recycled content, as well as making the packaging recyclable at end of life. However, recycling rates in the United States are in decline, demand for recycled material outstrips supply (creating capacity and pricing challenges), and infrastructure is not sufficient to support recycling at the scale necessary.
We use our assets, relationships, and voice to improve recyclability and recycling in practice and to drive progress against our goals.
Designing for Recyclability
Packaging that is not designed for recycling can contaminate the recycling system and reduce the value of an already limited source of recycled content. According to Walmart supplier reporting, in 2022, approximately 80% of global Walmart private brand plastic packaging was designed for recycling. We achieve that through the following strategies:
Setting standards for recyclability of product packaging: Through the CGF Plastic Waste Coalition of Action we have endorsed the "Golden Design Rules," which identify ways to improve recyclability by phasing out materials, colors, and labels from packaging that are challenging to recycle. We share these design rules with our suppliers to encourage our suppliers to incorporate these standards into their packaging. To enable traceability of sustainable packaging attributes, Walmart partnered with a third party to develop a flexible web-based solution called E-halo that allows our teams to secure item-level data on packaging recyclability.
Providing tools and other resources: We support suppliers in designing for recyclability by providing resources, including:
- Recycling Playbook: The Walmart Recycling Playbook—a publicly available resource developed in collaboration with The Association of Plastic Recyclers (APR), the Sustainable Packaging Coalition and Pure Strategies—provides voluntary guidelines for streamlined packaging design. The Playbook continues to be refined through the development of shorter modules focused on specific product types and updated to reflect the current state of U.S. recycling.
- Circular Connector: In 2022 we launched the Circular Connector, designed to help bridge the gap between those who need more sustainable packaging solutions and those offering them. The tool allows companies to submit packaging innovation solutions through a dedicated web page on our Sustainability Hub. Submissions are screened to check for alignment with our corporate sustainability goals, and those that pass are made available to our private brand teams for consideration. Solutions entered into the Circular Connector are also automatically considered for recognition through the U.S. Plastics Pact’s Sustainable Packaging Innovation Award program. To date, over 200 more sustainable packaging solutions and more than 4,000 connections have been identified via this program.
An International Approach to Plastic Waste
The March 2022 meeting of the United Nations Environment Assembly (UNEA) marked the start of a multi-year negotiation to launch a binding global treaty to end plastics pollution. This new treaty would seek to control the production of certain plastics, restricting and monitoring the use of dangerous chemicals, and implementing a robust reporting environment to encourage transparency around plastic waste. At Climate Week NYC in September 2022, The Ellen MacArthur Foundation (EMF) and World Wildlife Fund (WWF) launched the Business Coalition for a Global Plastics Treaty to advocate for an ambitious plastics treaty. Walmart endorsed the vision and supported this coalition during the first negotiation meeting of the Global Plastics Treaty (INC1). The International Chamber of Commerce (ICC) has also launched a new working group on the Plastics Treaty, of which Walmart is the chair.
Equipping Customers
Customer follow-through remains a key challenge, so we seek to make it as easy as possible to recycle. The How2Recycle® label helps customers easily identify the best means of recycling product packaging; as of 2022, 92% of Walmart U.S. private brand food and consumables supplier-reported sales came from items carrying the How2Recycle label and 83% of Sam’s Club U.S. private-brand supplier-reported sales came from items carrying the How2Recycle label.
Walmart offers customers the opportunity to recycle in many of our stores around the world. In an effort to significantly increase access to in-store plastic bag and stretch film recycling, in 2021 collection bins were distributed to all Walmart U.S. stores.22 Internationally, we also have customer recycling programs. For example, we collected ~1.8 million pounds of recyclable materials in Chile, Africa, Central America, and Mexico in 2022.
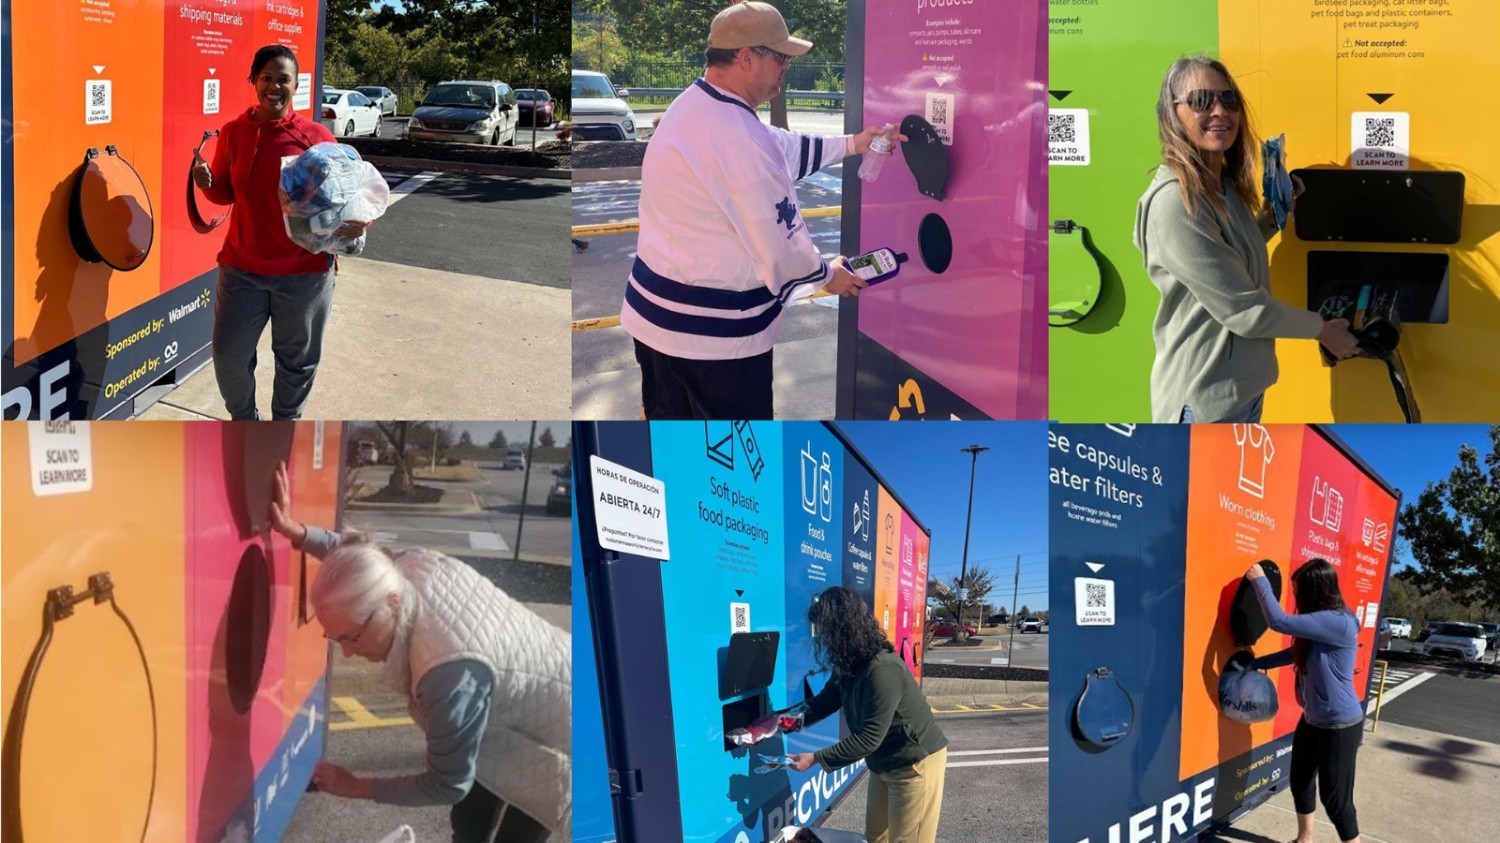
In 2022 we launched the Community Recycling HUB, a pilot program to help customers find outlets for hard-to-recycle waste (e.g., plastic toys, worn clothing, ink/office supplies, pet packaging, oral care, coffee capsules), most of which is not curbside recyclable. In 2022, the pilot collected over 28,000 pounds at three locations in Oklahoma and Arkansas. We will use learnings from this pilot to identify potential ways to scale the program. Walmart collaborated in a pilot with TerraCycle and Procter & Gamble in the U.S. and L'Oreal in Canada to offer free in-store recycling collection for empty hair care, skincare, and cosmetic packaging. In the U.S. this program ran at stores located throughout Pennsylvania, New Jersey, Oklahoma, and Arkansas while the Canadian program is now running nationally.
Our international markets are also testing recycling solutions. For example, in Mexico and Central America we have recycling programs to collect traditional recycled materials (e.g., cardboard, glass, paper, aluminum, tin), as well as hard-to-recycle plastics (e.g., HDPE, PET, BOPP) and coffee capsules. In 2022, ~752,000 lbs. of waste was recovered through these post-consumer programs.
Expanding Municipal Recycling Capacity and Systems
Increasing consumer recycling rates requires expanded municipal and large-scale public recycling capacity as well as consumer behavior change. We advocate for and invest in solutions to solve this problem.
Extended Producer Responsibility (EPR) laws assign responsibility for the end-of-life treatment of products and packaging to manufacturers and distributors, often including fees to fund take-back and recycling activities. There is a growing body of EPR regulations at the state level (in 2022 at least 15 states introduced EPR packaging legislation) and increasing discussion of EPR at the federal level and internationally. Walmart co-leads the Consumer Goods Forum (CGF) Plastics Coalition, endorsed the CGF principles on EPR, and participated in CGF’s U.S. EPR coalition with the goal of supporting model EPR legislation at the state and federal level. We also worked with the Retail Industry Leaders Association (RILA) to develop a Retail Viewpoint for upcoming legislative sessions with an aim to shape favorable recycling regimes.
To complement these efforts, the Walmart Foundation has invested substantially to help improve municipal infrastructure, including by:
- Supporting Beyond 34, a multi-stakeholder initiative led by the U.S. Chamber of Commerce Foundation that aims to advance the circular economy in cities and regions across the U.S. by providing a scalable approach to identify and implement high-impact waste solutions tailored to local needs.
- Supporting The Recycling Partnership's (TRP) Material Recycling Coalitions, which have issued 45 grants to Material Recycling Facilities and Reclaimers in the last two years, improving recycling access for ~12M households across the US and increasing recovery by an estimated 85M pounds annually.
- Investing in TRP's 50 Cities and 50 States programs, which equip cities and states with tools to improve infrastructure, address recycling contamination, coordinate efforts and develop networks, and improve data.
- Helping to establish the Closed Loop Infrastructure Fund (CLIF), which provides below-market rate loans to finance projects that build out circular economy infrastructure in the United States. In total, CLIF has invested over $82M in circular solutions (the Walmart Foundation contributed $10M of the total).23
- Funding the Recycling Partnership's establishment of the Center for Sustainable Behavior & Impact, which is building a database of community portraits that help identify key trends, attitudes, motivations, and barriers to recycling. This data will be leveraged to create a free, interactive tool that will be piloted to help inform community leaders, policy makers, and industry on specific intervention strategies to improve adoption of circular approaches.
- Supporting Accelerating Circularity, which seeks to find new uses for used textile products. Among other things, they have released reports outlining the potential for circular textiles in the US and trials to test approaches.
Reducing Product Packaging
An outright reduction in product packaging is the most direct way to prevent packaging waste. We engage suppliers and others to find appropriate solutions through Project Gigaton (see above) and other strategies including:
Providing tools and resources. For example:
- With philanthropic support from Walmart, The Recycling Partnership and SYSTEMIQ came together to help accelerate industry adoption of circularity commitments through the development of Plastic IQ, a free, data-driven scenario modeling tool to help companies set effective circularity strategies (including reducing packaging). Since the launch in May 2021, the Plastic IQ tool has been used by over 260 companies, representing approximately 20% of all plastic packaging generated in the U.S. Delterra is working to expand the tool globally.
- In collaboration with the Sustainable Packaging Coalition and the Association of Plastic Recyclers, Walmart created a Sustainable Packaging Playbook, which provides best practices on eliminating packaging components or layers, and "right sizing" packaging, and considers reduced transportation miles via optimizing package design.
Convening thought leaders and suppliers to discuss best practices and challenges. For example, in November 2021, Walmart hosted a virtual Sustainable Packaging Innovation Summit with more than 4,000 in attendance or accessing the replay online. The summit explored solutions to the plastics problem and provided guidance on how to spur action and achieve reduction goals. Walmart leaders, suppliers and NGOs addressed trends in innovation, public policy, and the importance of elimination, reduction, and reuse.
Working directly with suppliers to reduce packaging. Walmart has embarked on a systematic category/item-level effort to eliminate and/or reduce packaging, including the format change of certain products. Examples from 2022 include:
- Consumables—Slider storage bags. A small adjustment to the zipper alignment resulted in slightly smaller packaging, which is projected reduce more than 400,000 lbs. of paperboard, more than 160,000 lbs. of corrugate, and more than 4,200 pallets annually.
- Home—Bath set. Adjustments to packaging to eliminate the plastic lid and transition to a paperboard box are projected to save 54 metric tons of plastic annually.
- Automotive—Work lights. Removed PET thermoforms from five items and transitioned to cardboard packaging, which is projected to eliminate 34 metric tons of plastic annually.
- Sporting goods—Table tennis set. Changed packaging from plastic clamshell to cardboard, reducing plastic, improving recyclability, and increasing the number of units that fit in a 40-foot container.
Reusing/Refilling
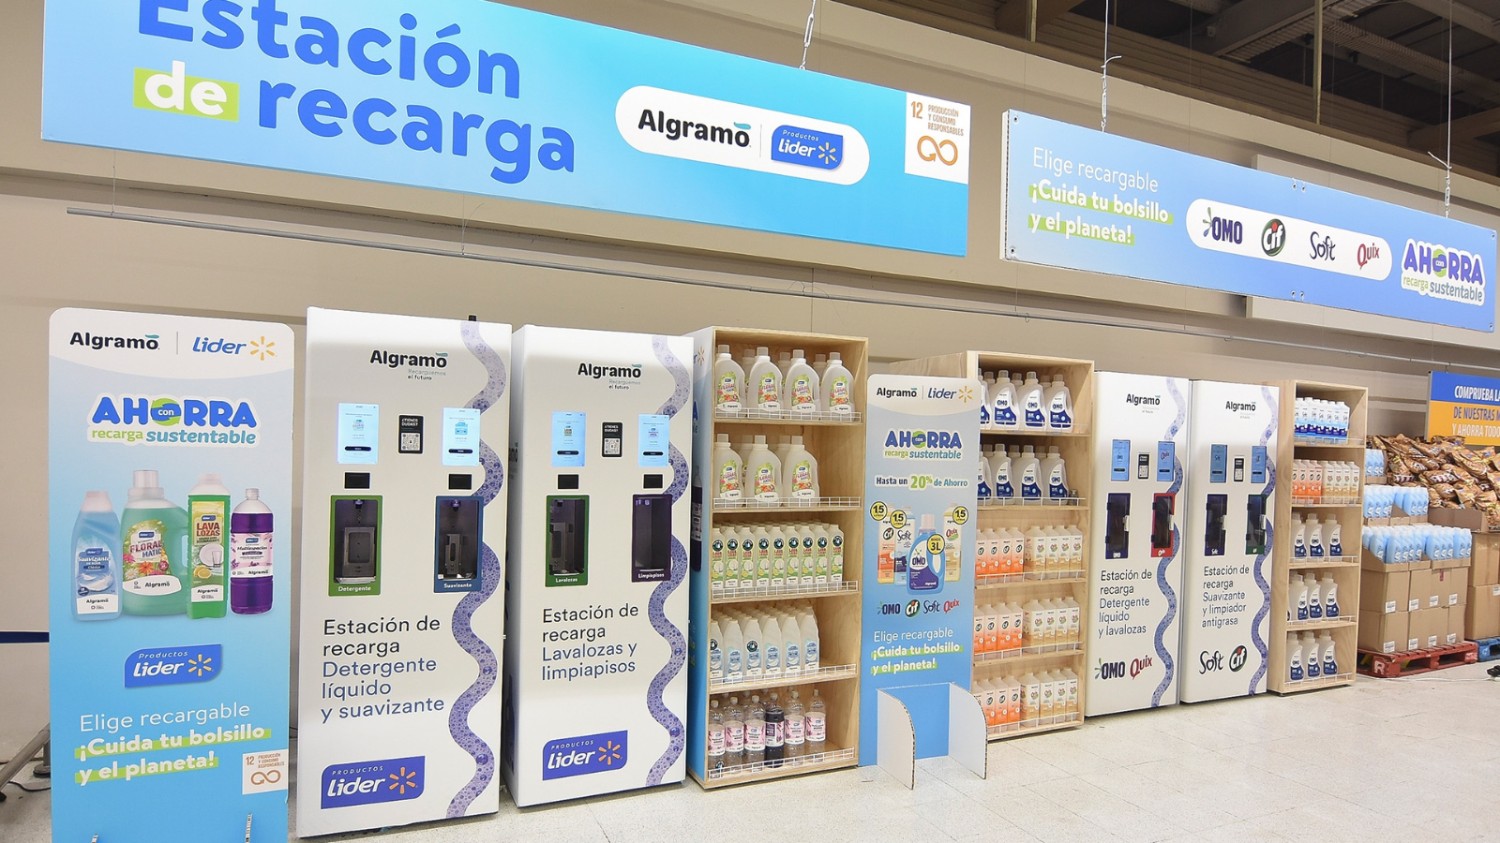
Walmart and the Walmart Foundation are supporting various reuse/refill initiatives with an aim to scale. In addition to selling larger refill-size packs of soaps and other consumables, Walmart is working with suppliers and others to pilot reuse and refill options, including piloting Cleancult paper-based refill cartons for hand soaps, dish soaps, all-purpose cleaners, and laundry in more than 3,000 Walmart U.S. stores, and testing Loop—a circular reuse platform that allows Walmart+ customers to purchase a product assortment in refillable, reusable containers, delivered to our customers' homes via our InHome platform. Additionally, the Walmart Foundation is supporting Vessel Works, in partnership with Perpetual, to design and pilot city-scale reuse systems in four cities across the U.S to help provide replicable models for scale; the Walmart Foundation is also supporting Resolve, Inc. to help align and apply reuse standards, including how equity is embedded in reuse systems and standards design.
Optimizing Secondary Packaging
Secondary packaging includes packaging required to transport product throughout our supply chains and from our facilities to customers' homes, including plastic bags, shipping packaging, pallets, strapping, and shrink wrap). To meet our zero waste and product packaging goals, we are focused on reduction, elimination, and substitution of secondary packaging materials.
Plastic Bags
Walmart is undertaking multiple efforts to reduce single-use plastic bag waste, which we estimate accounts for 13% of our global plastic packaging footprint as of 2022, a reduction of 2% since 2021.24
Transitioning to bagless options: We are transitioning to bagless options in markets that have high customer interest and/or a regulatory environment that make bagless the norm.
- In the U.S., more than 420 Walmart stores and Sam's Clubs in Colorado, Connecticut, Delaware, the District of Columbia, Maine, New Jersey, New York, Oregon, Vermont, and Washington are bagless as of May 2023. Online pickup and delivery services in these states are also bagless.
- Our stores in Mexico and Canada are also plastic bag-free.
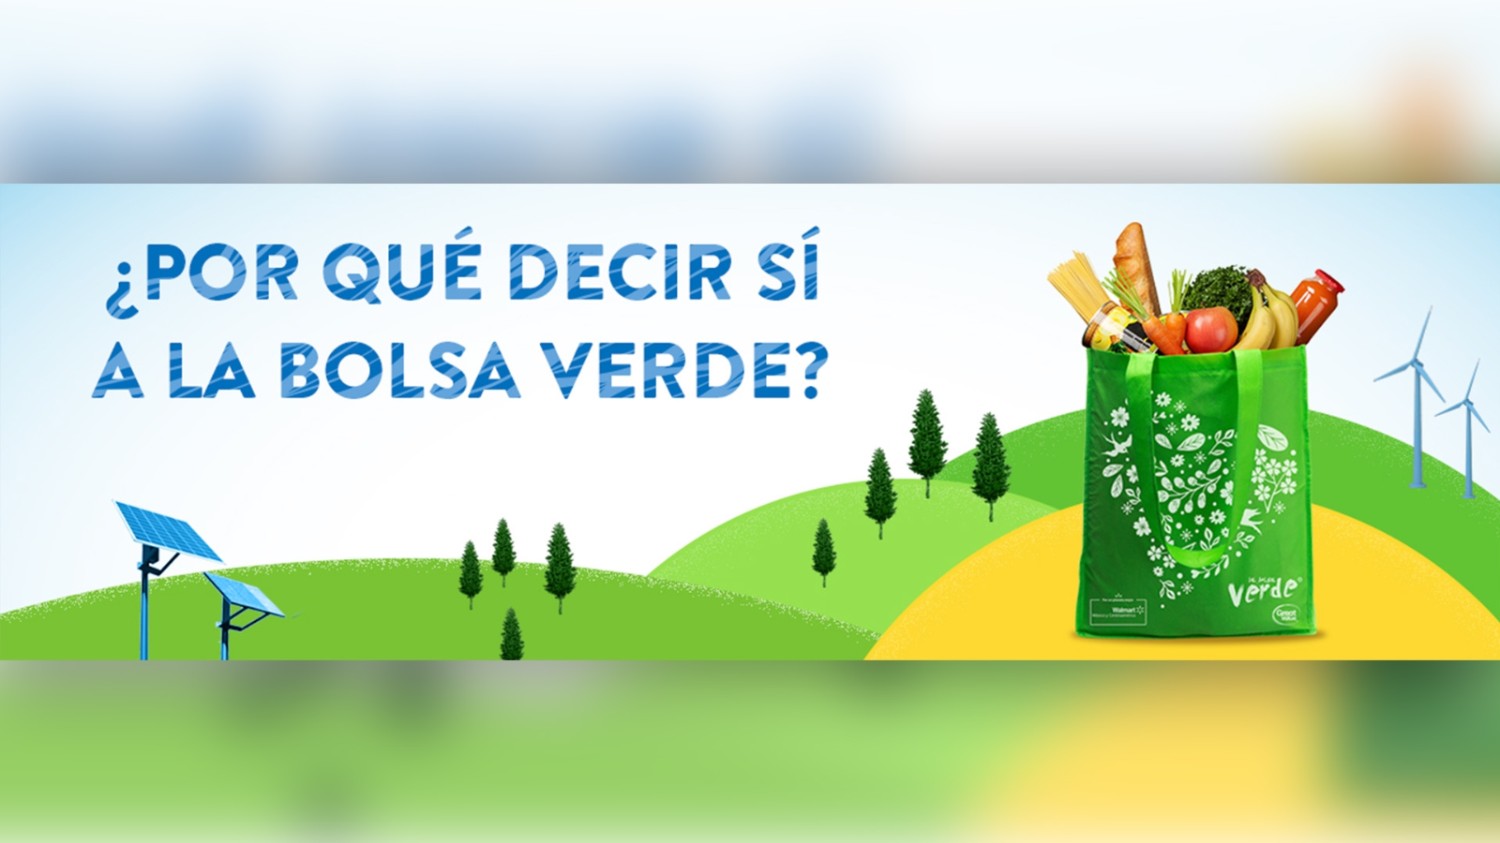
Encouraging customers to use reusable bags: To make it more convenient for customers to choose reusable options, we improved the placement of reusable bags and offered new designs. For example, our #SinBolsaPorFavor campaign in Mexico encouraged our customers to employ reusable bags by making a green bag available and inviting customers to bring their own. Watch the video.
Identifying alternatives to plastic bags: In 2020, we became a founding partner of Closed Loop Partners’ Beyond the Bag effort. We work with peers like Target and CVS Health, as well as innovators, to identify scalable alternatives to single-use plastic bags. This three-year initiative aims to identify, test, and implement viable design solutions and more sustainable models for single-use plastic retail bags. In addition to running pilot programs, the consortium’s broader work involves spurring innovation, advancing materials recovery, identifying best practices for policy, and engaging consumers. In 2023, the program released a new playbook to provide near-term single-use bag reduction solutions that can be implemented by any retailer.
Plastic bag recycling: In an effort to significantly increase access to in-store plastic bag recycling, in 2021 collection bins were distributed to all Walmart U.S. stores.22
E-Commerce Packaging
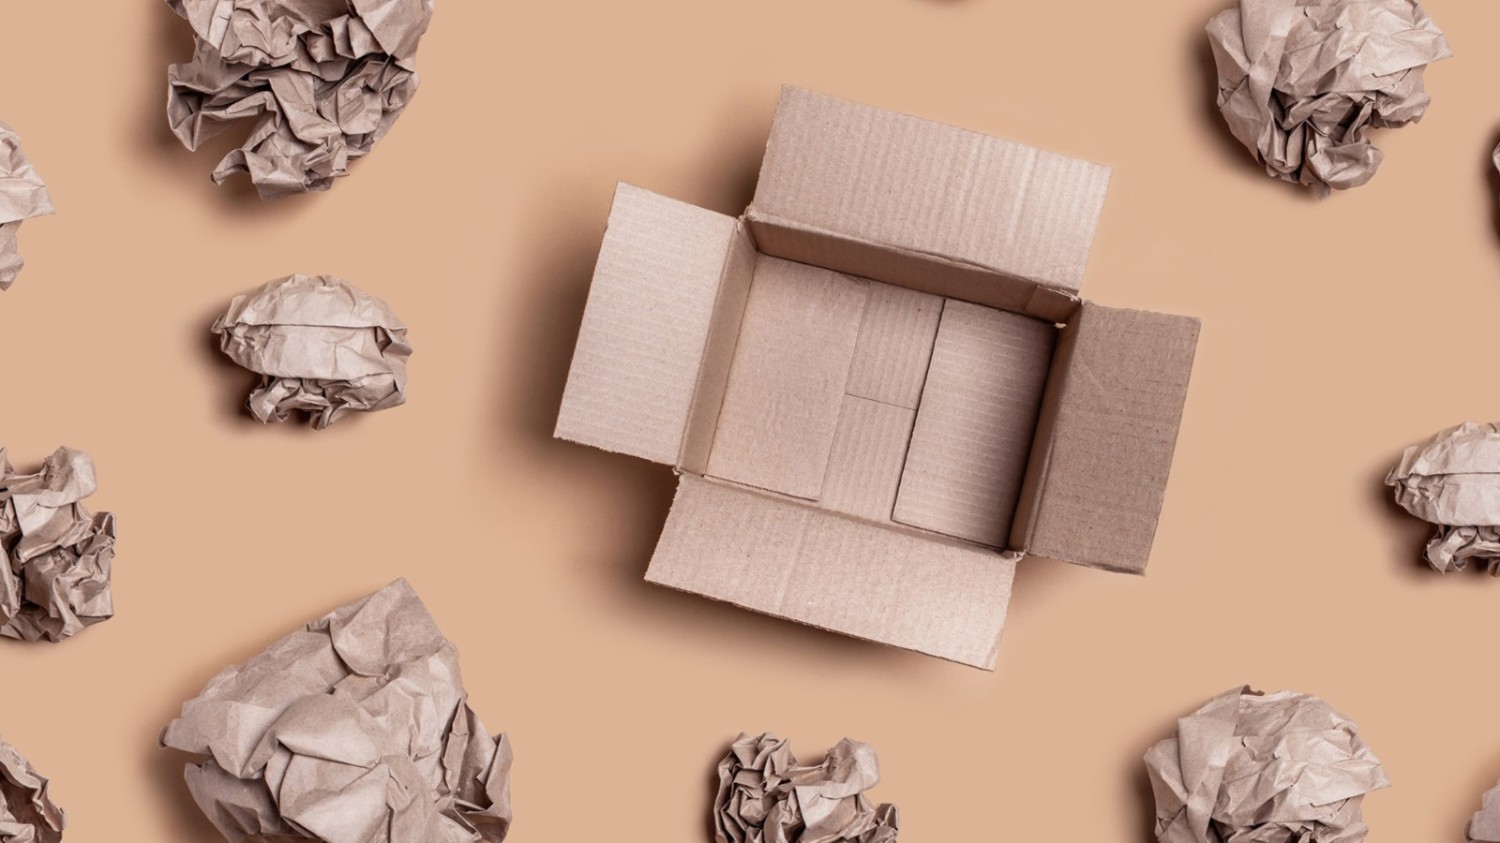
We ship and deliver millions of items every week, much of it shipped in cardboard boxes and mailers containing paper and plastic. We have improved practices to reduce secondary packaging in e-commerce, including shipping products in their original containers where possible, optimizing packaging size for contents, combining shipments, and fulfilling orders locally.
Additionally, our engineering teams are researching and designing new practices to reduce secondary packaging and improve recyclability. Merging new packaging designs with our automated technology also will allow for the reduction of secondary plastic packaging and avoid shipping packages with empty space.
Shrink Wrap and Pallet Packaging
We manage the shipment of millions of pallets of products into and out of our distribution and fulfillment centers. Many of these pallets are covered in plastic shrink wrap and corrugated cardboard. We have established recycling programs for these materials (see Eliminating Operational Waste above), but also focus on creative ways to integrate post-consumer/industrial recycled content into our product mix. For example, we partner with third party manufacturers to convert used shrink wrap into trash bags that we use in our operations as well as sell under our private brands. We are also exploring alternative materials that may help us shift away from shrink wrap and plastic-based stretch films.
Reducing Food Waste in Our Value Chain
According to the Pacific Coast Collaborative, food waste is responsible for 6% of U.S. greenhouse gas (GHG) emissions and is the number one material in landfills (which is the third largest source of methane in the U.S.) Our initiatives to reduce food waste are designed to span the entire food supply chain. In addition to implementing best practices in our retail and distribution operations (see the operational waste discussion above), we engage with suppliers and others in the food industry to accelerate progress on reducing food waste in value chains:
- We encourage our suppliers to measure and report food waste through Project Gigaton and introduce practices for emission reductions from diversion or reduction of organic wastes including food waste. In 2022, more than 475 suppliers reported food waste reductions and/or date labeling initiatives through Project Gigaton.
- Walmart joined other large food retailers in committing to engaging at least 20 key suppliers to halve food loss and waste by 2030—known as the Champions 12.3 "10x20x30" initiative. As of April 2023, Walmart has recruited and engaged 23 suppliers, and of these engaged suppliers, at least 12 have reported food waste to the Food Waste Atlas or other sources since joining 10x20x30.
- In line with the CGF Date Labeling Call to Action, we encourage suppliers to standardize date labeling as an aid to improved customer decision-making. This includes using the standard term "Best If Used By" on packaged-food labeling if the date is simply related to optimal quality rather than safety, in which case the standard term is "Use By." We estimate that in FY2023, 96% of our Walmart U.S. private-brand food supplier-reported sales came from items carrying "Best if Used By" or "Use By" standardized date label.
- We are the Retail Co-Chair of the CFG Food Waste Coalition of Action, and work with other retailers and suppliers striving to halve per capita global food waste at the retail and consumer levels. Coalition workstreams focus on upstream suppliers (e.g., building an on-farm global calculator to quantify food loss and waste), operations (e.g., sharing best practices, harmonizing reporting practices), and consumer education (e.g., Walmart-CGF food waste pilot, consumer education campaign). We are also a signatory to the U.S. Department of Agriculture and U.S. Environmental Protection Agency’s Food Loss and Waste 2030 Champions program.
Increasing Product Circularity
Products themselves can also become waste—both at end-of-cycle and prematurely (e.g., through product returns). We work to reduce product waste and improve circularity, including through the following initiatives:
Pre-owned merchandise: Walmart customers can shop for a wide range of pre-owned products at everyday low prices on our online platform, thereby giving the items new life and keeping them out of landfills.
- As of April 2023, there are approximately 6.8 million pre-owned listings across categories such as books and fashion.
- We partnered with thredUP, an online consignment and thrift store founded in 2009 that helps people join the circular economy by creating an easy way to buy and sell pre-owned clothes, shoes, and accessories. Our partnership allows Walmart customers to shop 1.2 million "new," "like new," or "gently used" items on Walmart.com/thredUP, featuring more than 3,000 brands at up to 80% off estimated retail price, and use free returns in our stores if needed.
Refurbishment/repair programs:
- In 2022, we launched Walmart Restored, an online marketplace where customers are able to buy refurbished products that have been professionally inspected and tested to work and look like new by top-rated suppliers. The program averages more than 100,000 product listings across approximately 300 marketplace sellers. In addition to the online platform, we offer an in-store refurbished electronics section in over 200 stores. Read more.
- In partnership with CExchange, Walmart operates a trade-in program for qualifying technology (e.g., cell phones, wearables, tablets, game consoles, video games, and voice speakers) in the U.S. Customers can send unwanted pieces of technology to CExchange for resale and recycling in exchange for online gift cards. Also, we offer ecoATM kiosks to make it simple and convenient for consumers to sell back used smart devices. In FY2022, we collected 3.4 million devices for reuse and recycling through ecoATM machines. We also now offer device repair services in more than 225 U.S. stores.
Unsold general merchandise and customer returns: When general merchandise goes unsold or is returned, our teams attempt to put them to the highest-value recovery channel, such as reselling to customers, stocking the clearance aisle, reselling to online platforms, liquidating to B2B resellers, and donating the products so that they do not find their way to landfills. While our disposal preference is to recycle the products, many cannot be recycled due to practical challenges (e.g., mixed content), regulatory, and supplier limitations. We also look for alternative uses for products that would otherwise be landfilled, such as by collaborating with Ecotech International Inc. to repurpose plant containers, buckets used to store bakery ingredients, and damaged or returned items, from Walmart stores. Ecotech reprocesses this waste into alternative plastics at its U.S.-based facilities. The plastic created is repurposed into new, sustainable products like pet containers, coolers, automotive, baby products and seasonal items that Walmart sells. Ecotech, reports that it processed and sorted over two million pounds of Walmart waste in CY2022.
Challenges
- The global shortage of recycled materials has made it difficult to source recycled feedstock in quantities and price points that support of our recycled content goals. Recycled content costs more than virgin and is expected to remain more expensive well into the future. While a growing number of global brands have set targets to include more recycled content in their products by 2025, producers of recycled materials have struggled to keep pace with demand. Without a breakthrough in cost and availability of recycled content, we may face challenges in meeting our recycled content and virgin material reduction goals.
- Success requires engagement and large-scale behavior change among customers, suppliers and associates. Frontline associates have competing business priorities, including inventory management and customer service; sourcing and merchandising associates must balance factors such as shelf life, product quality, and damage when making packaging decisions. Suppliers must be willing and able to implement product design and packaging options consistent with Walmart's objectives, and customers need to make choices in favor of circularity when purchasing products and managing packaging material (e.g., reducing, reusing, recycling).
- Walmart’s business will continue to evolve and grow, potentially putting pressure on our targets.
- The public policy environment often does not support waste prevention, management, or recycling. For example, lack of incentives and inconsistent policy regimes make it difficult for us to scale strategies to reduce waste.
- Innovative materials and product designs are needed. At times, single-use plastics promote health, safety, cost and/or convenience; alternative materials that do not exacerbate other environmental issues do not yet exist for all use cases.
- Infrastructure necessary to manage recyclable and compostable materials is lacking in many areas. Recycling infrastructure varies across communities, meaning that some recyclable materials nevertheless end up in landfills. Despite our engagement with suppliers to shift to compostable packaging, compostable facilities are not yet equipped to handle the growing amount of compostable plastic. Until facility numbers are increased, compostable plastic may continue to find its way to the landfill.
- Walmart’s size and the variability of culture, policy, and infrastructure across many markets pose challenges to scaling waste management processes, tools and behavior change across thousands of facilities.
- Catastrophic events can exacerbate many of the above factors. For example, when one of our facilities experiences a natural disaster or other disruption to refrigeration system power, we often must dispose of all fresh/perishable items.
Additional Resources
Endnotes
1. As used in this issue brief, "zero waste" means meeting or exceeding Zero Waste International Alliance (ZWIA) business recognition program requirements, which include adoption of ZWIA definition of zero waste and achievement of 90% or more diversion of all discarded resources from landfills, incinerators and the environment. Zero waste goal and reporting scope includes waste materials and products generated in Walmart’s owned facilities and its operations (stores, clubs, warehouses, return centers, truck maintenance garages, etc.).
2. Based on review of material handling and waste diversion processes, as reported by waste vendors, food banks and stores. In cases where certified or otherwise documented weights were not available due to industry challenges, they have been estimated based on waste audits, historical data, extrapolation for similar facilities in size and scope, etc.
3. Enhancements to Mexico's zero waste accounting methodology were undertaken in FY2022, which led to a recalculation of the waste diversion percentages reported in prior years. Recalculated metrics are provided here where relevant. In June 2022, the following metrics were changed to reflect the latest accounting methodology: (1) Mexico's diversion rate was adjusted from 75% to 71% for 2020; and (2) Walmart's global diversion rate was adjusted from 81% to 80% for 2020.
4. Original goal covered U.S., Canada, Japan, and the U.K., and now includes Mexico. Walmart divested its retail operations in the U.K. and Japan in February and March of 2021, respectively.
5. Walmart's operational food waste reduction goal is aligned with Target 12.3 of the United Nations Sustainable Development Goal (SDG). Progress towards food loss and waste reduction goal measured in conformance with the Food Loss and Waste Protocol's Food Loss and Waste Accounting Standard (FLW Standard) for quantifying food and/or associated inedible parts removed from the food supply chain. This figure is based on review of material handling and waste diversion processes, as reported by waste vendors, food banks and stores. In cases where certified or otherwise documented weights were not available due to industry challenges, they have been estimated based on waste audits, historical data, extrapolation for similar facilities in size and scope, etc. The 2016 baseline was adjusted to remove markets (Argentina, Japan, U.K.) that have since been divested; reported reduction is as against this adjusted baseline.
6. Packaging metrics are measured in weight and based on supplier reports through a supplier survey. Proxy data were calculated to provide data for suppliers that did not complete the survey or provided unusable data. Proxy data are meant to represent an estimate of how much packaging those suppliers / markets may utilize to provide an overall picture of Walmart’s entire packaging footprint. The calculation is based on supplier participation in the survey as a percentage of net sales and known packaging data. Walmart private brand suppliers representing 78% of Walmart global private brand net sales reported packaging data in 2020; in 2021 the figure was 80% and in 2022 the figure was 89%.
7. Walmart divested its business in Argentina in 2020 and its businesses in the U.K. and Japan in 2021. Because of the sale of Walmart’s Argentina business in late 2020, we were unable to capture sufficient packaging data for the Argentina market; to represent this market’s business in 2020, we used the 2018-2019 private brand packaging survey for Argentina. Walmart divested its businesses in the U.K. and Japan in early 2021; because the businesses were divested early in the year, we did not proxy packaging data for the time Walmart owned those businesses and the 2021 packaging figures represented here do not include the U.K. or Japan.
8. Calculations include all private brand plastic packaging and single-use plastic and reusable bags in North America. For the time frame of the private brands packaging survey, we instructed suppliers to use their latest or most recent 12-month period for which they have data available. If they reported last year, use the same reporting period as the initial/prior reporting year to avoid gaps or overlap with the prior year’s submissions. "North America" refers to our businesses in the U.S., Canada, and Mexico.
9. Previously, this percentage was reported as 9%; during our 2021 quality assurance review for our 2020 comparative period, we found 4 suppliers with reporting errors that affected our prior year's reporting.
10. Calculations include all private brand plastic packaging and single-use plastic and reusable bags globally. For the time frame of the private brands packaging survey, we instructed suppliers to use their latest or most recent 12-month period for which they have data available. If they reported last year, use the same reporting period as the initial/prior reporting year to avoid gaps or overlap with the prior year’s submissions. "Global" refers to all of our global retail businesses.
11. Previously, this percentage was reported as 9%; during our 2021 quality assurance review for our 2020 comparative period, we found 4 suppliers with reporting errors that affected our prior year reporting.
12. The 2020 and 2021 calculations follow the 2021 Reporting Guidelines for The New Plastics Global Commitment, and includes all private brand primary, secondary, and tertiary plastic packaging, including single-use plastic and reusable plastic bags globally. For the time frame of the private brands packaging survey, we instructed suppliers to use their latest or most recent 12-month period for which they have data available. If they reported last year, use the same reporting period as the initial/prior reporting year to avoid gaps or overlap with the prior year’s submissions. For suppliers that did not complete the survey or provided unusable data, proxy data was substituted to provide a full estimate of global private brand packaging. For the proxy calculation, a market level approach was used.
13. Previously, this percentage was reported as 59%; during our 2021 quality assurance review for our 2020 comparative period, we found 4 suppliers with reporting errors that affected our prior year reporting.
14. The calculation includes all private brand plastic packaging and single‐use plastic and reusable bags globally. The estimation was calculated by extrapolating supplier‐reported packaging data (weight in metric tons) in relation to supplier participation percentage of net sales.
15. Previously, this was reported as 1,400,000 MT; during our 2021 quality assurance review for our 2020 comparative period, we found 4 suppliers with reporting errors that affected our prior year reporting.
16. Walmart previously reported this figure for additional markets. Walmart divested its retail operations in Argentina, the U.K., and Japan in November 2020, February and March 2021, respectively. 2020 totals include markets that have since been divested. 2021 totals include only retained markets. 2022 totals include Central America, but 2020 and 2021 do not. The substantial decrease from 2020 to 2021/2022 is largely due to the U.K. and Japan divestitures, as these markets were leaders in consumer recycling programs.
17. Primary packaging is packaging that goes home with the consumer. This percentage excludes the net sales of private brand items that do not use primary packaging. For the time frame for the private brands packaging survey, we instructed suppliers to use their latest or most recent 12-month period for which they have data available. If they reported last year, use the same reporting period as the initial/prior reporting year to avoid gaps or overlap with the prior year’s submissions.
18. Based on discounted food sold through Walmart U.S. Customer Value Program (CVP) and Sam's Club U.S. discount program in fresh meat. FY2023 sales represent a decrease from the 190 million units sold through Walmart U.S. stores in FY2022 due to changes in program execution.
19. Based on reports from Feeding America. Includes Walmart U.S. and Sam's Club donations.
20. Numbers refer to the ASTM International Resin Identification Coding System.
21. Percentages in table may not add up to 100% due to rounding.
22. On occasion, in-store plastic bag and film recycling bins may be unavailable for logistical reasons.
23. Reported capital deployed by Closed Loop Infrastructure Fund through the end of December 2022, including deployment of recycled capital.
24. This figure was 14% in 2020. We originally reported it as 11%; during our 2021 quality assurance review for our 2020 comparative period, we found 4 suppliers with reporting errors that affected our prior year reporting.